How I found memory leaks in the Golang app using “pprof”
Here, I’ll be writing about how we can squeeze out the performance & at the same time can be spared from doing refactor when you are facing a performance bottleneck.

Golang is a wonderful language. When it comes to developing System apps and Web apps, I would suggest considering Golang. The constant rising of demand for Golang developers is proof of its popularity.
After analyzing the pros and cons, we gave it a try. We had a specific use case where our service’s build time to be super low and at the same time, it should use the minimum resources possible. Moreover, we are working with micro-service architecture, so that made it possible to use different tech stack other than sticking to only one tech.
Overall, our Golang + Graphql app was performing well. It was serving plenty of requests in a blink of a second. Nothing wrong with regular requests & regular load. The problem arise when we started to test the service with Load Testing/Performance Test scripts.

Initially, we found that our app was misbehaving when put under a severe load. We were monitoring the resources continuously and after a few hours of Performance testing, our service was using enough resources (memory & CPU) of the cluster to take the entire Cluster consisting of 20+ micro-services on its knee. It was frustrating and scary as well that our primary reason for using Golang was not getting fulfilled here. So, we analyzed it and found that it was not the error of the Golang eco-system, but our code that was the culprit.
Now, Here comes pprof in the picture.
Brief about pprof from its Github repo,
pprof is a tool for visualization and analysis of profiling data.pprof reads a collection of profiling samples in profile.proto format and generates reports to visualize and help analyze the data. It can generate both text and graphical reports (through the use of the dot visualization package).
Also, there is very informative documentation of pprof here. You can use pprof with just a few lines of code. Plus it is safe to use pprof in the production environment as it will create 5% overhead at max that too with considering the replicas. Meaning if we have 10 replicas of a pod, the overhead will be 0.5%.
How did I do it?
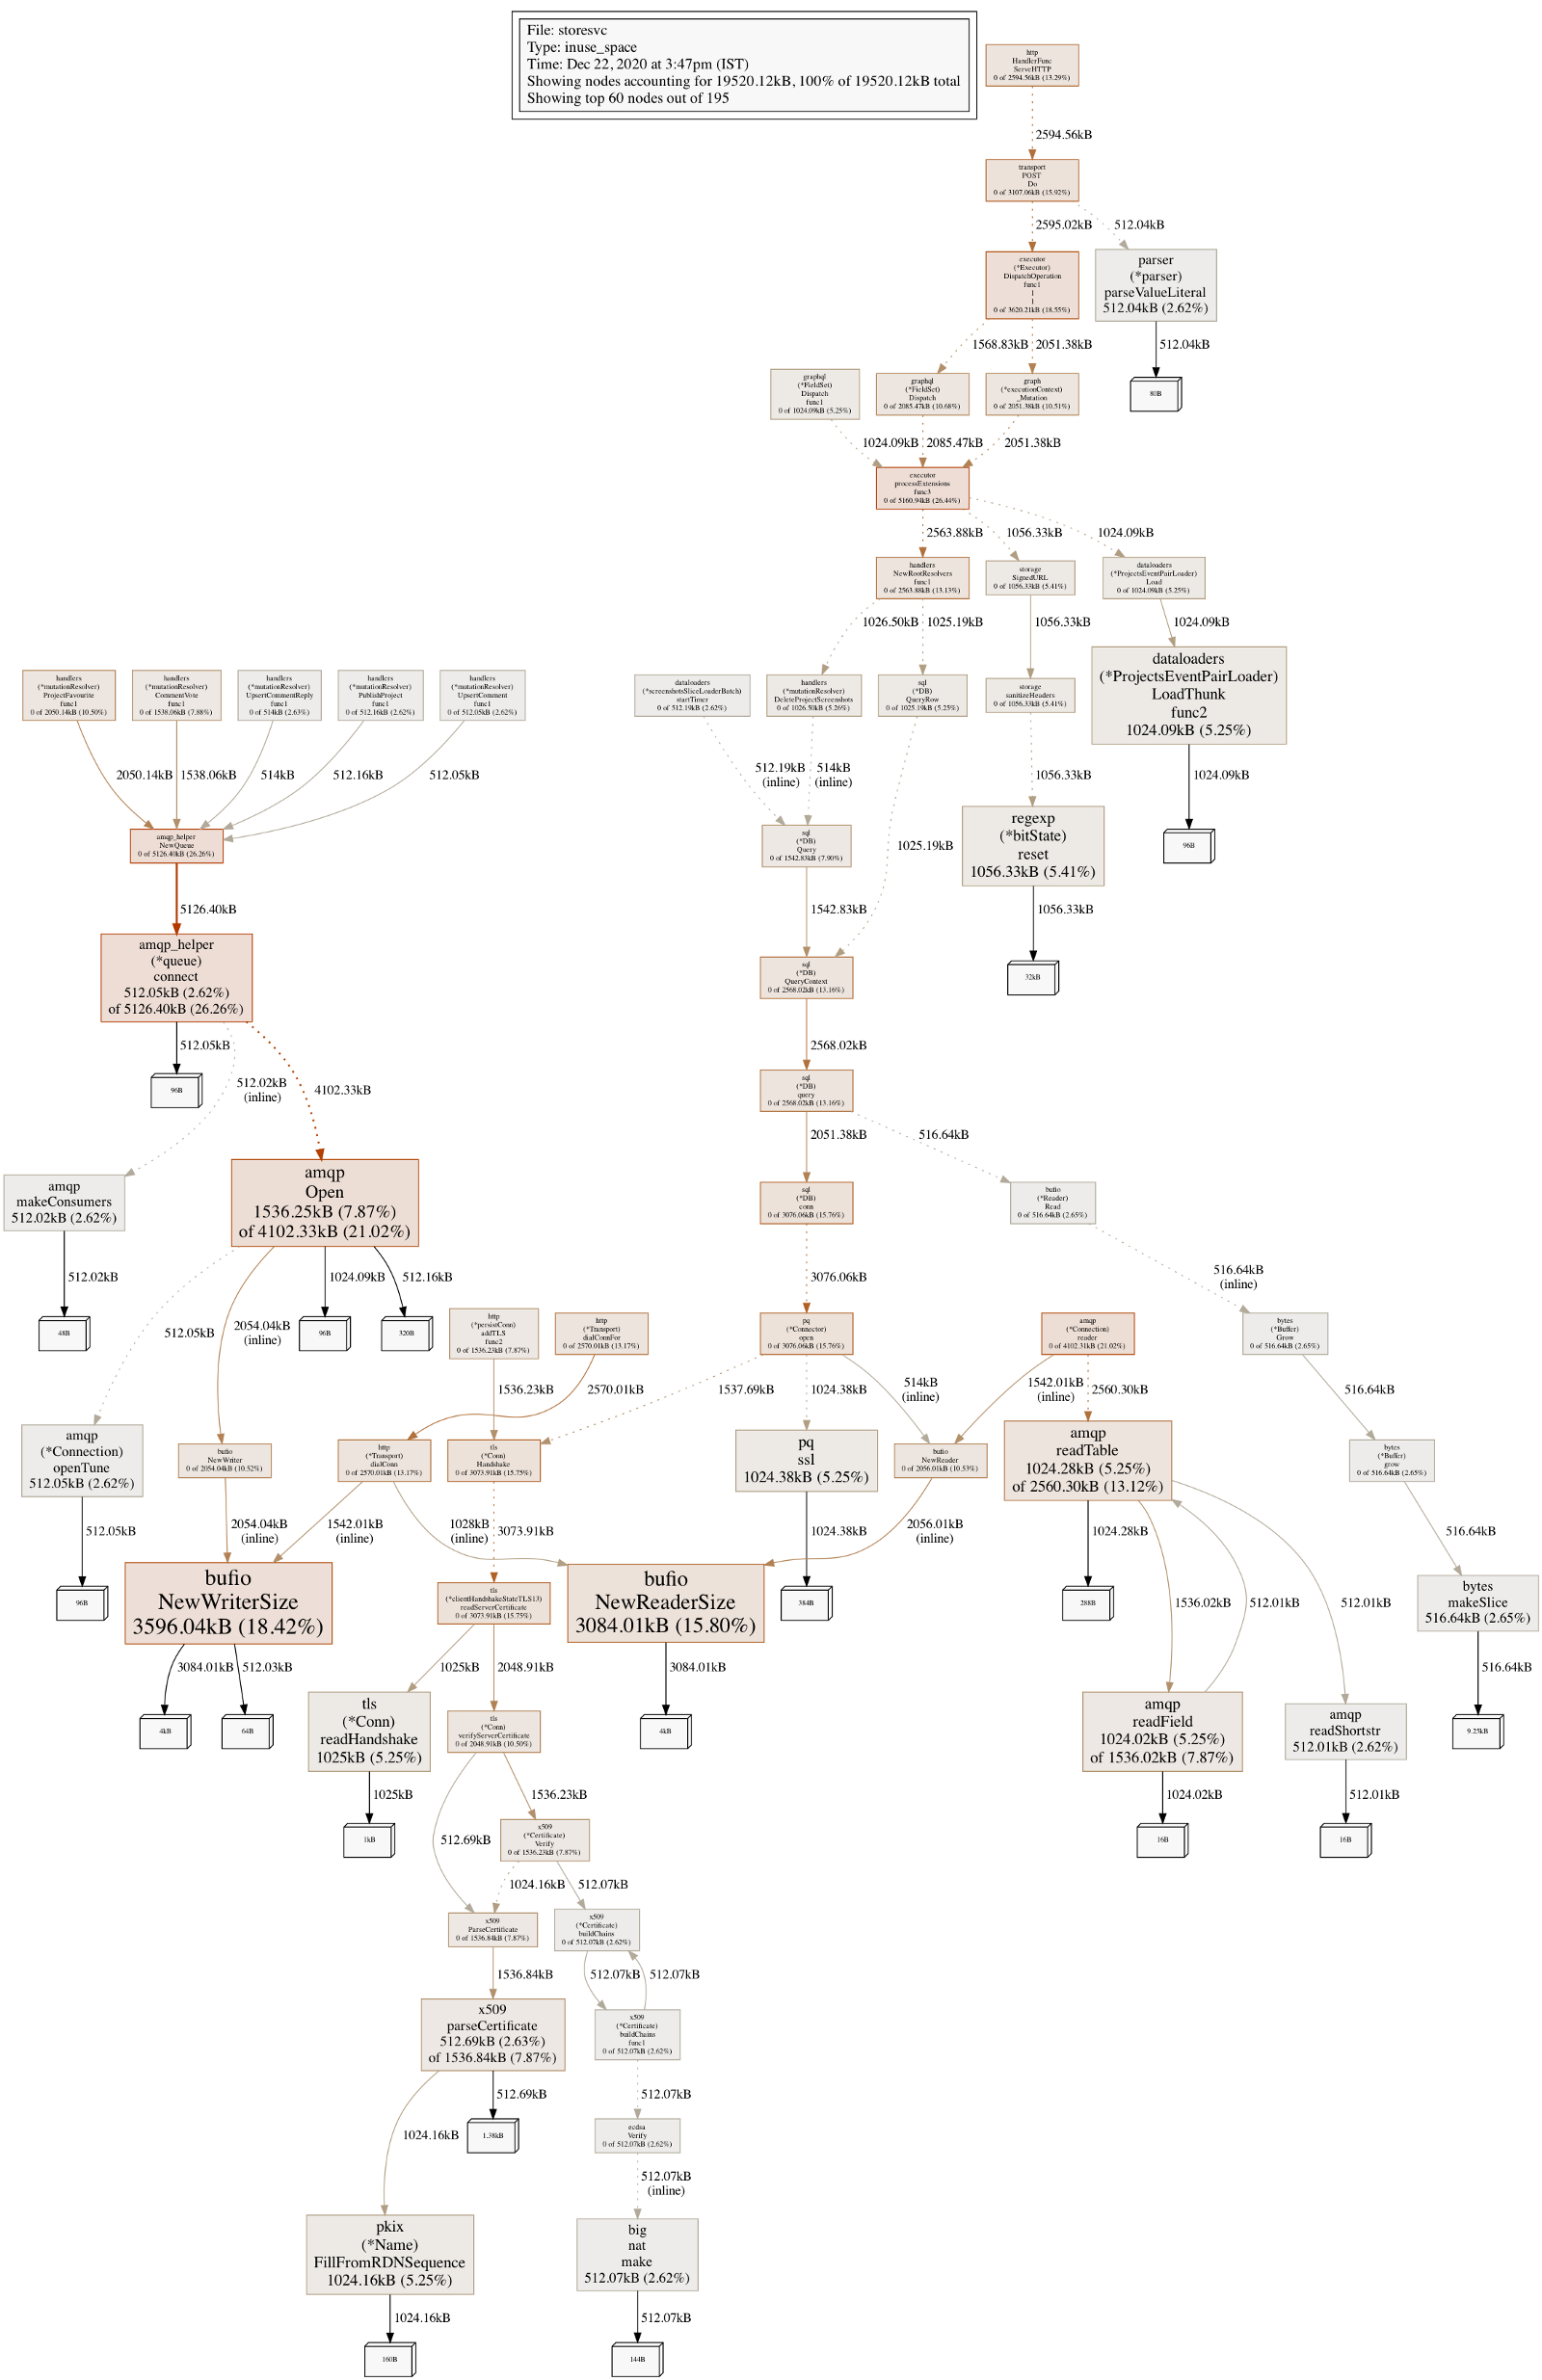
So, using pprof tools, I had generated the memory and CPU profiles. Below is the PNG formatted chart of these profiles. Just a glance at this chart was enough to tell me that my amqp_helper (basically my queue handling file) was having some issues. I analyzed the code and VOILA!!!, In my code, the amqp (we use RabbitMQ) connections were not closed and they took their size of memory.

How can I implement it?
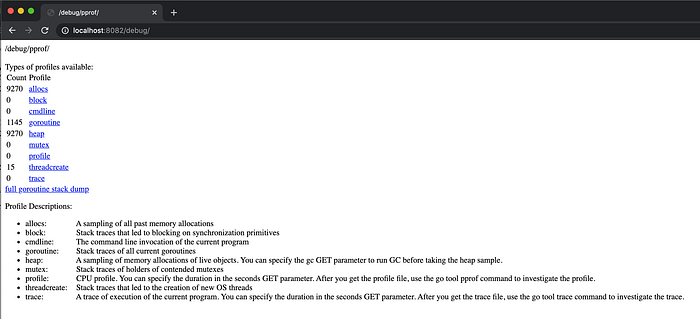
I would recommend checking out the init() function in pprof.go. That will help you understand the routes of /debug/pprof/ with great clarity. Go through the below template and use it at your convenience.
When you visit http://localhost:8082/debug, you can see different profiles that go provides.
Generate charts
Keep this server running in one terminal, and run the below command to generate the chart
- Memory profile
go tool pprof -png http://localhost:8082/debug/pprof/heap > heap.pngThis will create a heap.png file in your current directory. Example.
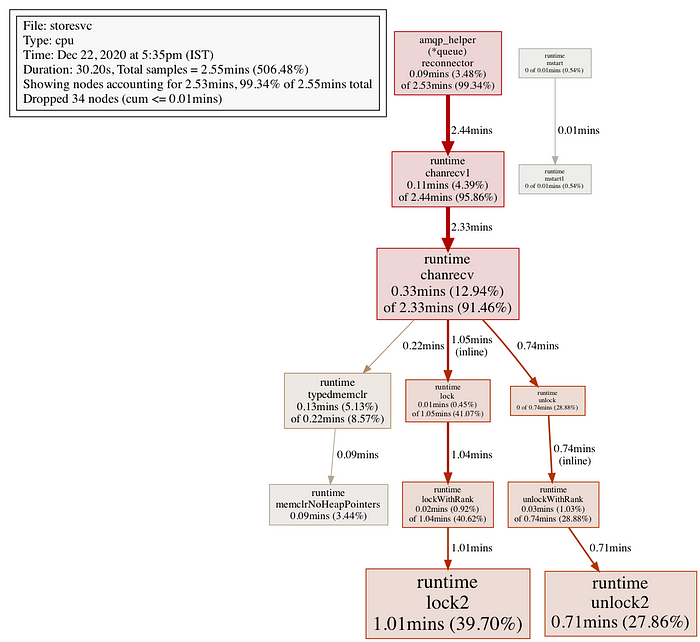
2. CPU profile
go tool pprof -png http://localhost:8082/debug/pprof/profile > profile.pngBelow is an examle of a CPU profile chart. Using above command, you can create and alanyze different profiles.
Common memory leaking scenarios
- Inappropriately closing or not closing connections at all. This includes database connections, queue connections, third-party libraries.
- Inappropriate usage of defer() functions.
- Using large strings/slices/subslices and doing multiple/heavy operations on it.
- Pointers referring to un-used variable values.
- Hanging Goroutines
- Using Finalizers improperly
